Complexity Theory and Worldbuilding History
Background
- Reading Simply Complexity by Neil Johnson
- Chapter 2 introduces us to the random walk (a very useful concept in thermodynamics as well)
- Introducing feedback makes a complex system
- In Chapter 3, Johnson makes the case that music is a complex phenomena, in that it is fractal
- I also watched this YouTube video from Bucephalus Studios about procedurally generated history
- I had the idea to combine the two
Process
- Step 1: create random walk
- Not too difficult using random and numpy libraries. The result looks like this:
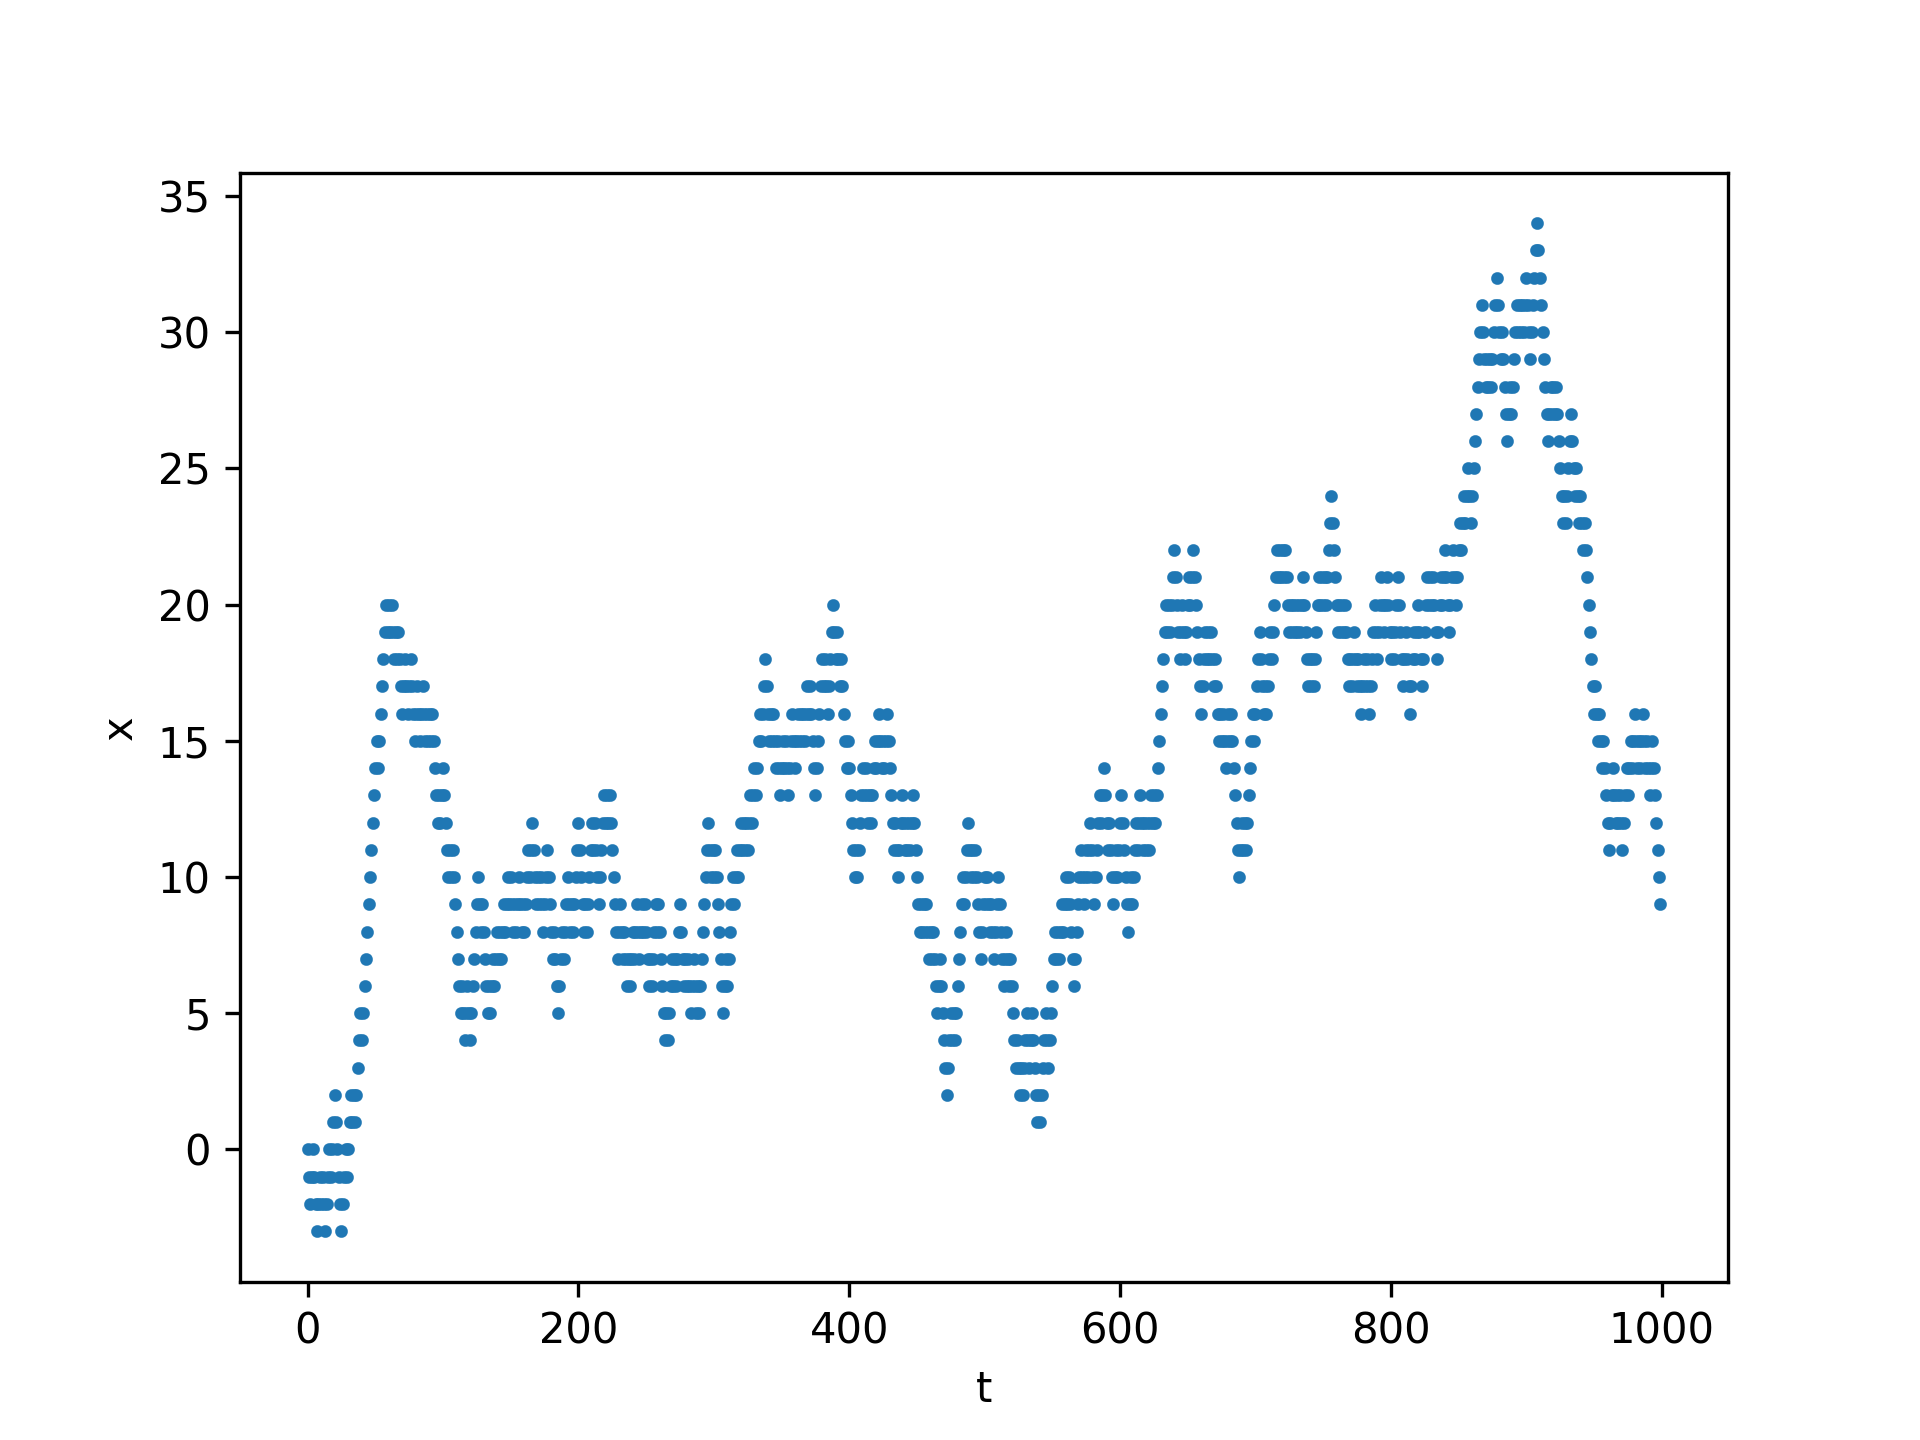
- Not too difficult using random and numpy libraries. The result looks like this:
- Step 2: add feedback
- Decided to make this an 8 point instability scale
- Weight of the random walk changes depending on how far away you are from the center. The further away, the higher the chance of moving back towards the center
- Result looks like this:
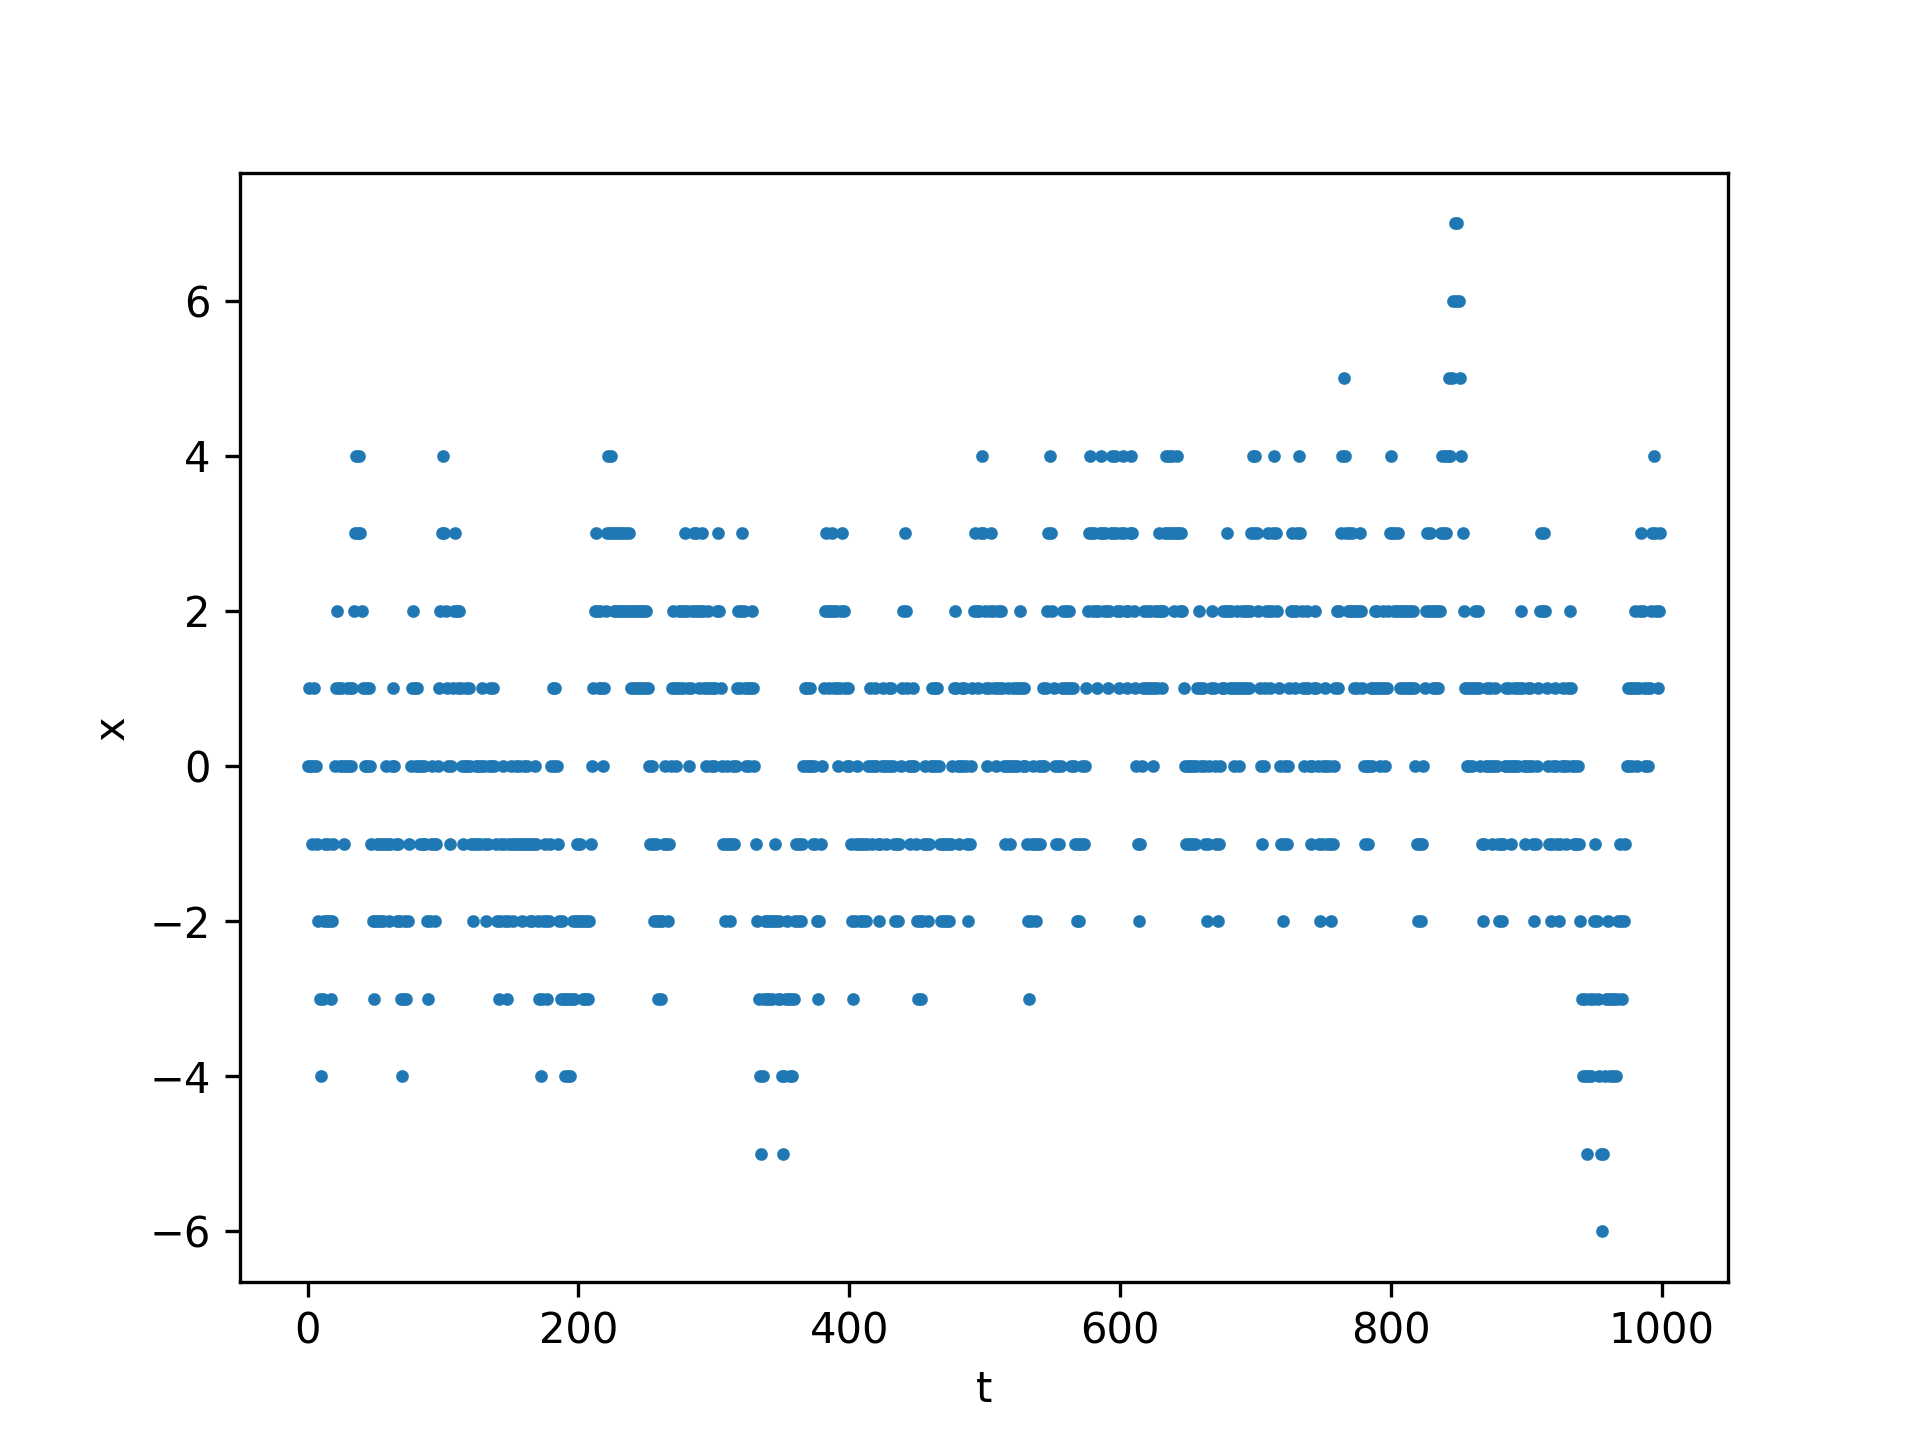
- Step 3:
- Turn the complex walk into a narrative
- I did this through a dictionary with two keys: the stability level (absolute value) and the stability trend (are we getting more stable, or less stable)
- The resulting history looks something like this:
'Peace', 'Tax Dispute', 'Peace', 'Long Winter', 'Border Skirmishes', 'Earthquake', 'Major Recession', 'Valuable Resource Discovered', 'Taxes Raised', 'Bumper Crop', 'Peace', 'Long Winter', 'Peace', 'Trade Dispute', 'Border Skirmishes', 'Great Work of Art', 'Peace', 'Tax Dispute', 'Peace', 'Long Winter', 'Failed Harvest', 'Earthquake', 'Great Building Project', 'Peasant Uprising', 'Great Building Project', 'Bumper Crop', 'Peace', 'Long Winter', 'Blockade', 'Bumper Crop', 'Failed Harvest', 'Shortages', 'Great Building Project', 'Peasant Uprising', 'Taxes Raised', 'Bumper Crop', 'Blockade', 'Great Work of Art', 'Peace', 'Tax Dispute', 'Peace', 'Tax Dispute', 'Peace', 'Long Winter', 'Blockade', 'Great Work of Art', 'Blockade', 'Bumper Crop', 'Peace', 'Long Winter'
Building a Network
- Part of what makes a complex system complex is its ability to adapt to external stimuli
- What if we put the histories in a network and allowed them to influence each other?
- Rule of influence: if a neighbor has higher disorder increase the chances of becoming more unstable
- See Appendix C to get the nitty gritty details
- To track correlations, I looked at the average distance between a history and its neighbors. Positive differences mean that the average neighbor is more chaotic than a history while negative differences mean that the history is more chaotic than its history
- I tried two designs: rings and strings. In a ring, every history has two neighbors. The string is the same, except that there are two ends which only have one neighbor
- The resulting graphs are pretty similar, and the reason why is because our rule of influence only lets us overcome the attractor at stability level 2.
- Here's what I mean: suppose that the current stability level of history 1 is 2. The threshold value for moving to a stability level of 3 is then
- Then suppose history 1 has two neighbors, both of which are more chaotic, this shifts the threshold value up
- Which gets us right back to a 50% chance of becoming more unstable
- If we were at stability level 5, then we would have a 35.7% chance of moving to level 6 only if our other two neighbors were at level 6 or 7, which is rare
- What if we increased the influence of neighbors?
Possible Extensions
- Expanding the dictionary (see Appendix B)
- It would be interesting to set up a network of histories and have the stability of a history's neighbors impact the weight of moving one way or another.
Appendix A: Stability Trends
- Because I'm a nerd, I made a 2D histogram of the stability level vs the Stability trend:
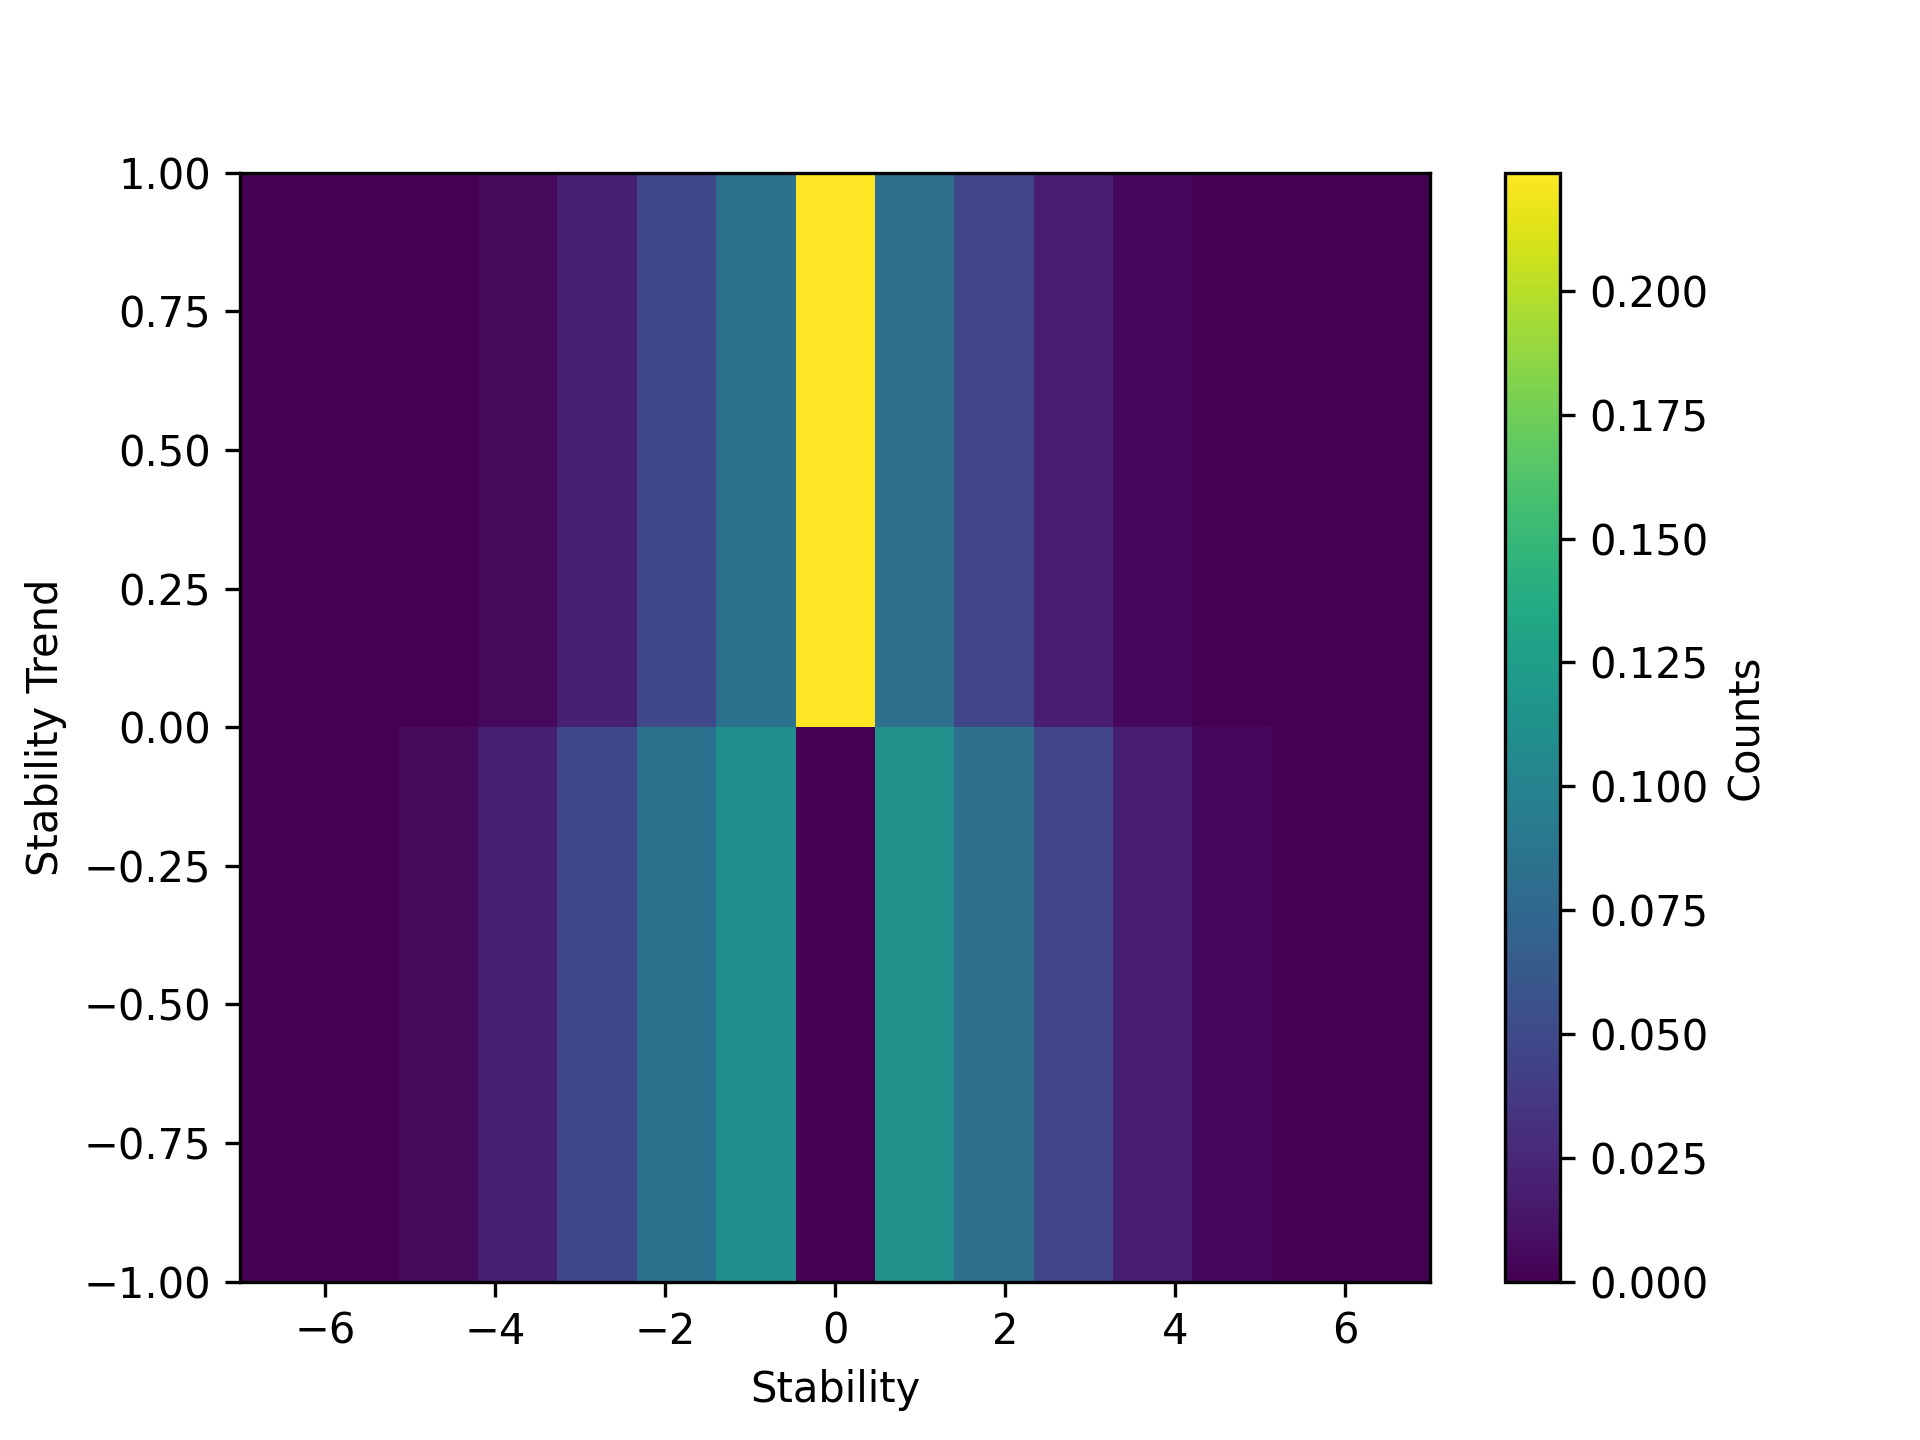
- Which shows us what we expect: there are more values closer to the middle. This implies that for the best results, the event dictionary should be widest at those stability levels
Appendix B: Event Dictionary
- Amalgam of my own events and some provided by ChatGPT
- Note that 0 and 7 do not have stability trends, since by definition you can only get to 0 by increasing stability and 7 by decreasing stability
- Enjoy!
{
    0: ['Peace'],
    1: {
        1 : ['Bumper Crop', 'Great Work of Art'],
        -1 : ['Tax Dispute', 'Trade Dispute', 'Long Winter']
    },
    2: {
        1: ['Taxes Raised', 'Great Building Project'],
        -1: ['Failed Harvest','Blockade', 'Border Skirmishes']
    },
    3: {
        1: ['Draft Enacted', 'Valuable Resource Discovered'],
        -1: ['Peasant Uprising', 'Earthquake', 'Shortages']
    },
    4: {
        1: ['Government Reformation', 'New Religious Movement'],
        -1: ['Famine', 'Major Recession', 'War', 'Inquisition']
    },
    5: {
        1: ['Great Battle', 'Martial Law Declared'],
        -1: ['Attempted Coup', 'Plague']
    },
    6: {
        1: ['Warlords Rise to Power','City States Rise in Power'],
        -1: ['Civil War', 'Invasion']
    },
    7: ['Collapse', 'Meteor Strike', 'Volcanic Eruption']
}
- In the future, I'll add more events, focusing particularly on stability levels 1-3 since those are the most likely to be selected.
Appendix C: Code
- If you want to play with the code, I've copied it below:
import random
import matplotlib.pyplot as plt
import matplotlib
import numpy as np
import time
import copy

class History():

    def __init__(self):
        self.stability = 0
        self.base = .5
        self.thresh = .5
        self.step = 1
        self.multiplier = 2.
        self.eps = .5/7
        self.history = []

    def destabilize(self):
        # This makes it more likely for a history to become more unstable
        if self.thresh == 1. or self.thresh == 0.:
            pass
        elif self.thresh < .5:
            self.thresh -= self.eps * self.multiplier
        elif self.thresh > .5:
            self.thresh += self.eps * self.multiplier
        else:
            if random.random() < .5:
                self.thresh -= self.eps * self.multiplier
            else:
                self.thresh += self.eps * self.multiplier

    def refresh(self):
        # This sets the base probability of a step
        self.thresh = self.base - self.eps * self.stability

    def complex_step(self):
        # This takes a complex step
        r = random.random()
        if r < self.thresh:
            self.stability += self.step
        else:
            self.stability -= self.step
        self.history.append(self.stability)

class Network():

    def __init__(self, map=dict()):
        self.map = map

    def eval(self, events):
        # this method evaluates the histories
        for e in range(events):
            self.eval_step()

    def eval_step(self):
        self.refresh()
        self.update()
        for k in self.map.keys():
            k.complex_step()

    def update(self):
        # this method updates the thresh value for each key in map
        for k in self.map.keys():
            neighbors = self.map[k]
            for n in neighbors:
                # if a neighbor is less stable than a history, it is destabilized
                if abs(k.stability) < abs(n.stability):
                    k.destabilize()

    def refresh(self):
        # this method refreshes each key in map
        for k in self.map.keys():
            k.refresh()
And here are some analysis functions if you want to make some plots
def unpack(network, t):
    for i,k in enumerate(network.map.keys()):
        plt.scatter(t, k.history, label=f'history{i}',alpha=.5)
    plt.legend()
    plt.show()

def trend_analysis(network, t):
    for i, k in enumerate(network.map.keys()):
        lol = []
        for n in network.map[k]:
            lol.append(n.history)
        arr = np.array(lol)
        avg = np.average(abs(arr))
        h = copy.deepcopy(k.history)
        for j, el in enumerate(h):
            h[j] = abs(el)
        diff = abs(avg) - h
        plt.scatter(t, diff, label = f'hist{i}', alpha=.5)
    plt.legend()
    plt.ylabel('Average Distance to Neighbors')
    plt.show()

def stability_analysis(network):
    lol = []
    for k in network.map.keys():
        lol.append(k.history)
    arr = np.array(lol)
    print(arr)
    plt.hist(arr.flatten(),bins=[i for i in range(-7,8)], density=True)
    plt.show()